
How I built Beneish Pass App using Streamlit🎗️

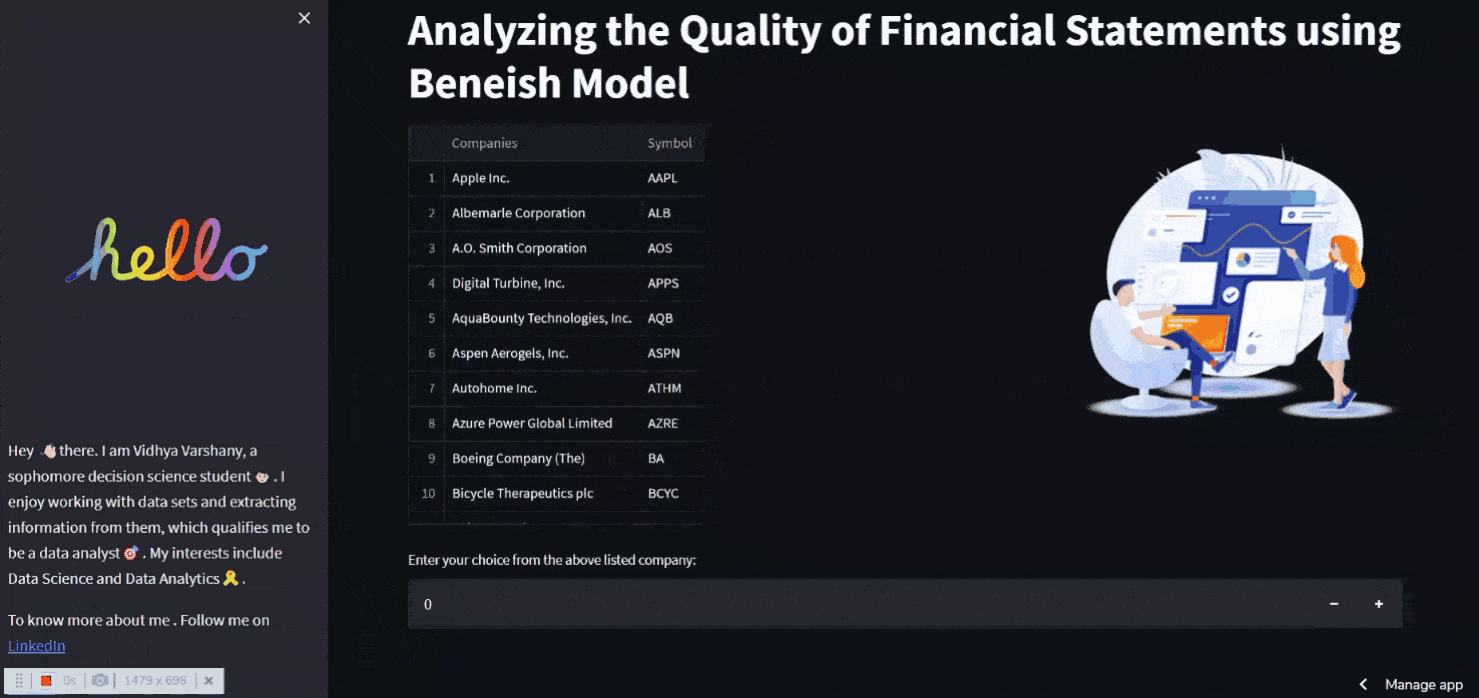
I 'm a Data Analyst, Blogger 🎉.I'm an enthusiastic learner currently pursuing my Masters in Decision and Computing Sciences👩🏼🎓.I do post blogs on my projects, useful resources, self-help lessons. Currently learning about LLMs.🧠 So,Stay tuned to get your Vibe❤️ With BrainiacSpace🌌 to fill your TechSpace✔️
Overview👀
A Simple, stream-lined web app to use the financial statements of different companies during the year 2021-2022 to find out if the company's earnings have been manipulated.
Objectives🎯
This Web App is based on the Beneish model, which is a math model that uses eight variables and financial ratios to figure out if a company has manipulated its earnings. An M-Score is made based on a company's financial statements to show how much earnings have been changed.
Use Case👥
Students at Cornell University were able to spot manipulation by the big Enron Corporation years before Wall Street could figure out how bad it was. This was a common use of the model. People lost their jobs, money, and reputations in what is thought to be one of the biggest frauds in history. One of the biggest auditing and accounting firms in the world, Arthur Andersen LLP, also lost its reputation.
About the Beneish Model🔍
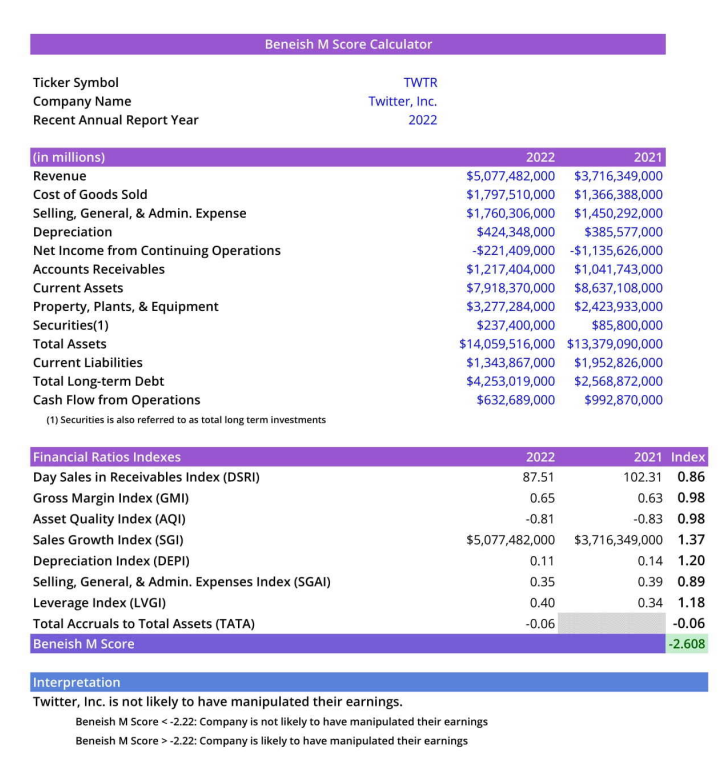
Creator - Professor Messod Beneish
Purpose - to uncover financial manipulation by identifying the red flag areas
Beneish M-score Equation
M-score = −4.84 + 0.92 × DSRI + 0.528 × GMI + 0.404 × AQI + 0.892 × SGI + 0.115 × DEPI −0.172 × SGAI + 4.679 × TATA − 0.327 × LVGI

| M - Score | Inference |
| < - 2.22 | This company doesn't manipulate. |
| > -2.22 | This company manipulates. |
Below, you can find out more about the Beneish Model 🔎
Limitations❗
TOOLS USED📲
🛠 Programming Language - Python🐍
𝗗𝗮𝘁𝗮 𝗦𝗼𝘂𝗿𝗰𝗲 - yfinance (API), yahooquery 📉
𝗗𝗮𝘁𝗮 𝗮𝗻𝗮𝗹𝘆𝘀𝗶𝘀 - Pandas 🐼
𝗔𝘂𝘁𝗼𝗺𝗮𝘁𝗶𝗼𝗻 - openpyxl (Python ->Excel) 📊
𝗪𝗲𝗯 𝗔𝗽𝗽 - Streamlit (Framework) 🎯
📂𝗰𝘂𝘀𝘁𝗼𝗺 𝗰𝗼𝗺𝗽𝗼𝗻𝗲𝗻𝘁𝘀 - hydralit_components ✨
𝗗𝗮𝘁𝗮 𝗪𝗮𝗿𝗲𝗵𝗼𝘂𝘀𝗶𝗻𝗴 - Snowflake ❄️
𝗩𝗶𝘀𝘂𝗮𝗹𝗶𝘇𝗮𝘁𝗶𝗼𝗻 - Plotly 📌
𝗔𝗻𝗶𝗺𝗮𝘁𝗶𝗼𝗻𝘀 - Lottie Files 📍
Data Fetching📝
from yahooquery import Ticker
# Fetching the Tickers Module
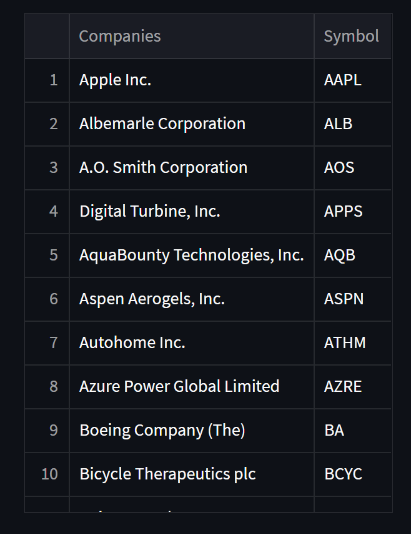
symbols = ['FB', 'AAPL', 'BRK.B', 'TSLA', 'MCD', 'VZ', 'BA', 'NKE', '^GSPC', 'NQ=F', 'ALB', 'AOS', 'APPS', 'AQB', 'ASPN', 'ATHM', 'AZRE', 'BCYC', 'BGNE', 'CAT', 'CC', 'CLAR', 'CLCT', 'CMBM', 'CMT', 'CRDF', 'CYD', 'DE', 'DKNG', 'EMN', 'FBIO', 'FBRX', 'FCX', 'FLXS', 'FMC', 'FMCI', 'GME','GRVY', 'HAIN', 'HBM', 'HIBB', 'IEX', 'IOR', 'GOOGL', 'MAXR', 'MPX', 'MRTX', 'NSTG', 'NVCR', 'NVO', 'OESX', 'PENN', 'PLL', 'PRTK', 'RDY', 'REGI', 'REKR', 'SBE', 'SQM', 'TCON', 'TWTR', 'TGB', 'TRIL', 'UEC', 'VCEL', 'VOXX', 'WIT', 'WKHS', 'XNCR']
# Create Ticker instance, passing symbols as first argument
# Optional asynchronous argument allows for asynchronous requests
tickers = Ticker(symbols, asynchronous=True)
dat = tickers.get_modules("summaryProfile quoteType")
symb = pd.DataFrame.from_dict(dat).T
# flatten dicts within each column, creating new dataframes
dataframes = [pd.json_normalize([x for x in symb[module] if isinstance(
x, dict)]) for module in ['summaryProfile', 'quoteType']]
# concat dataframes from previous step
symb = pd.concat(dataframes, axis=1)
symb = symb[['shortName', 'symbol']].dropna()
symb = symb.sort_values('symbol')
symb.set_index('shortName', inplace=True, drop=True)
symb = symb.reset_index() # reset index
symb.index = symb.index + 1 # add 1 to each index
symb.columns = ['Companies', 'Symbol']
data = symb.copy()
symb['Companies'] = symb['Companies'].str.replace("'", "''")
- The symbols for each company are put in a list, and then the company names are retrieved with yahooquery's Ticker module and put in a pandas dataframe.
- The single quotes in the company names make it hard to store them in the database, so the single quotes are replaced with double quotes.
Data Analysis 📊
import yfinance as yf

comp = yf.Ticker(symb.at[ch, 'Symbol'])
incomeStatement = comp.financials
balanceSheet = comp.balancesheet
cashFlow = comp.cashflow
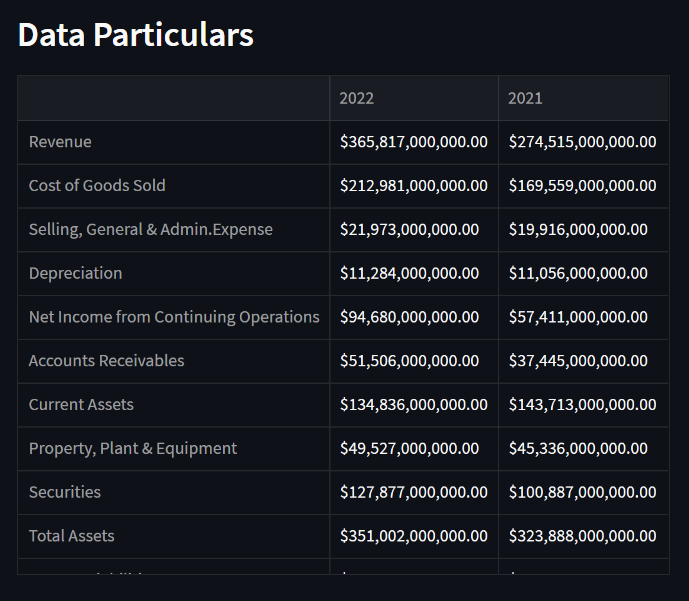
The Financial Statements are taken from Yahoo Finance based on the company's symbols (i.e., Tickers)
# Cleaning the data

    # Income Statement
    incomeStatement = incomeStatement[incomeStatement.columns[0:2]]
    incomeStatement.columns = ['2022', '2021']
    incomeStatement = incomeStatement.fillna(0).astype(float)

    # Balance Sheet
    balanceSheet = balanceSheet[balanceSheet.columns[0:2]]
    balanceSheet.columns = ['2022', '2021']
    balanceSheet = balanceSheet.fillna(0).astype(float)

    # Cash Flow
    cashFlow = cashFlow[cashFlow.columns[0:2]]
    cashFlow.columns = ['2022', '2021']
    cashFlow.dropna()
Details for each statement for 2021 and 2022 are obtained, and null values are removed. Also, relevant details must be retrieved and kept in a distinct dataframe to calculate the m-score. I'm not showing the code because it makes the blog longer; you may refer to the source code linked at the end.
Data Evaluation 🧮
functions .py
def DSRI(df):
    return (df.at["Accounts Receivables", "2022"] / df.at["Revenue", "2022"]) / (df.at["Accounts Receivables", "2021"] / df.at["Revenue", "2021"])

def GMI(df):
    return ((df.at["Revenue", "2021"] - df.at["Cost of Goods Sold", "2021"])/df.at["Revenue", "2021"]) / ((df.at["Revenue", "2022"] - df.at["Cost of Goods Sold", "2022"])/df.at["Revenue", "2022"])

def AQI(df):
    AQI_t1 = (1 - (df.at["Current Assets", "2022"] +
              df.at["Property, Plant & Equipment", "2022"]+df.at["Securities", "2022"])) / df.at["Total Assets", "2022"]
    AQI_t2 = (1 - (df.at["Current Assets", "2021"] +
              df.at["Property, Plant & Equipment", "2021"]+df.at["Securities", "2021"])) / df.at["Total Assets", "2021"]
    return AQI_t1 / AQI_t2

def SGI(df):
    return (df.at["Revenue", "2022"] / df.at["Revenue", "2021"])

def DEPI(df):
    DEPI_t1 = (df.at["Depreciation", "2021"] / (df.at["Depreciation",
               "2021"] + df.at["Property, Plant & Equipment", "2021"]))
    DEPI_t2 = (df.at["Depreciation", "2022"] / (df.at["Depreciation",
               "2022"] + df.at["Property, Plant & Equipment", "2022"]))
    return DEPI_t1 / DEPI_t2

def SGAI(df):
    return (df.at["Selling, General & Admin.Expense", "2022"] / df.at["Revenue", "2022"]) / (df.at["Selling, General & Admin.Expense", "2021"] / df.at["Revenue", "2021"])

def LVGI(df):
    return ((df.at["Current Liabilities", "2022"] + df.at["Total Long-term Debt", "2022"]) / df.at["Total Assets", "2022"]) / ((df.at["Current Liabilities", "2021"] + df.at["Total Long-term Debt", "2021"]) / df.at["Total Assets", "2021"])

def TATA(df):
    return (df.at["Net Income from Continuing Operations", "2022"] - df.at["Cash Flow from Operations", "2022"]) / df.at["Total Assets", "2022"]

def BeneishMScore(dsri, gmi, aqi, sgi, depi, sgai, lvgi, tata):
    return -4.84+0.92*dsri+0.528*gmi+0.404*aqi+0.892*sgi+0.115*depi-0.172*sgai+4.679*tata-0.327*lvgi
# Beneish M Score
    m_score = BeneishMScore(DSRI(data),
                            GMI(data),
                            AQI(data),
                            SGI(data),
                            DEPI(data),
                            SGAI(data),
                            LVGI(data),
                            TATA(data))
    if(m_score < -2.22):
        res = '##### Company is not likely to manipulate their earnings'
        st.write(f"##### M- Score = {round(m_score,2)}")
        st.write(f"{res}")
        # print(res)
    else:
        res = " ##### Company is not likely to manipulate their earnings"
        st.write(f"##### M- Score = {round(m_score,2)}")
        st.write(f"{res}"
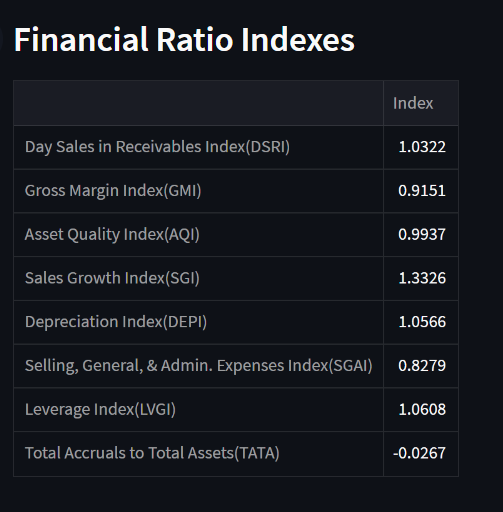
The above functions are used to calculate the m-score and are interpreted.

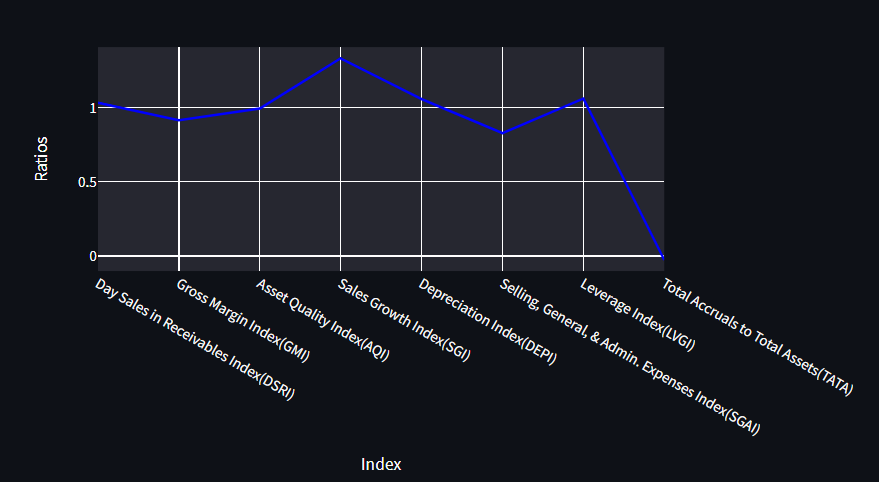
Visualization 🎴
import plotly.express as px

# The Line Chart using Plotly
    fig = px.line(
        temp_ratios,  # Data Frame
        x="Index",  # Columns from the data frame
        y="Ratios",
        title="Financial Ratio Indexes",
    )
    fig.update_traces(line_color="blue")

 with st.container():
      st.plotly_chart(fig)
Calling st.plotly chart() is all you need to do to get plotly charts in streamlit, and you can make different kinds of charts, like line charts and bar charts.
Data Warehousing 💽
Requirement - Snowflake Account Connect Streamlit to Snowflake - Streamlit Docs
Why use a database?
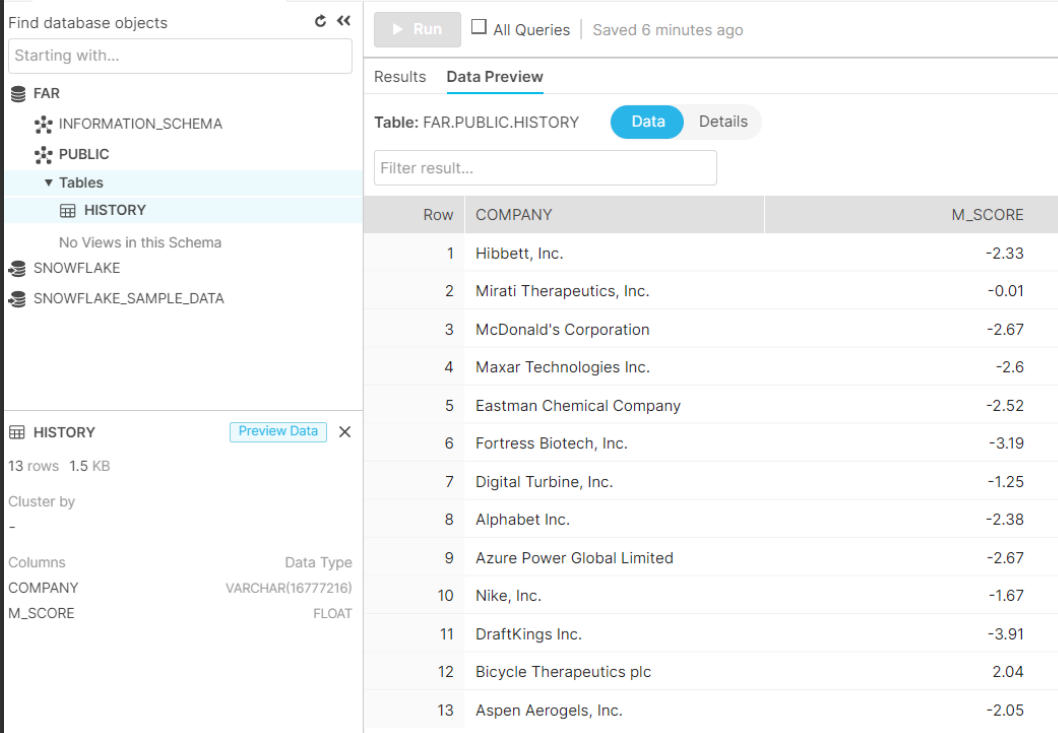
My ultimate goal is to remember the information so I can compare its results to those of the future. That is, the calculated m-score value for each company can be stored in a database table and compared with the future m-score values of the same companies for the coming years.
import snowflake.connector as sf

# SnowFlake  Initialize connection.
    def init_connection():
        return sf.connect(**st.secrets["snowflake"])

    conn = init_connection()

    cur = conn.cursor()
Initialize connection using this block of code
   try:
    cur.execute(
        f"INSERT INTO FAR.PUBLIC.HISTORY(COMPANY,M_SCORE) VALUES('{symb.at[ch, 'Companies']}',{round(m_score,2)})")
     cur.execute('''DELETE FROM FAR.PUBLIC.HISTORY WHERE (COMPANY)  in
        (SELECT COMPANY FROM FAR.PUBLIC.HISTORY GROUP BY COMPANY HAVING COUNT(COMPANY)> 1)
                    ''')
     cur.execute(
            'SELECT * FROM FAR.PUBLIC.HISTORY')
    finally:
        cur.close()
    conn.close()
- Once the user makes an entry for the first time, the Company name and its m-score are saved.
- When a user makes an entry for the same company, duplicate entries are deleted and updated in the database again. This is done to get rid of redundant data and make the best use of space.
❗ Challenges
The first significant problem for me is to find a data source that gives me the company names for their symbols (e.g., AAPL - Apple Inc.), because it's tough for users to search for specific firms using symbols.
✅ So I used a yahooquery module.
The next I ran into was writing manual formulas to figure out the details that some companies leave out, like COGS and long-term debts.
- The last challenge is to add information to the database without duplicating it. I also had trouble adding the company name to the database table.
For eg., Dr. Reddy's Laboratory Ltd. can't be stored directly since it has single quotes. Since it's a string, Snowflake will display it as "Dr. Reddy's Laboratory Ltd." Change Snowflake's single quote mark to a double quote "Dr. Reddy' 's Laboratory Ltd." so that the data can be added to the database

That's pretty much it for the implementation, and my favorite part is now giving my code a GUI look with Streamlit and automation using openpyxl (works only on local system). Let's start with Automation. Using Python's openpyxl module, you can easily manipulate the excel sheets.
Automation🤖

from openpyxl import Workbook, load_workbook

# Excel Automation

    wb = load_workbook('Beneish-M-Score.xlsx')
    ws = wb.active

    while True:   # repeat until the try statement succeeds
        try:
            # or "a+", whatever you need
            myfile = open("Beneish-M-Score.xlsx", "r+")
            break
            # exit the loop
        except IOError:
            print("Failed to open!!")

    ws['C3'].value = symb.at[ch, 'Symbol']
    ws['C4'].value = symb.at[ch, 'Companies']

    excel_data = data.reset_index(drop=True)
    excel_data.index = excel_data.index + 1

    for row in range(8, 21):
        for col in range(3, 5):
            char = chr(65 + col)
            if char == 'D':
                ws[char + str(row)] = excel_data.at[row-7, "2022"]
            if char == 'E':
                ws[char + str(row)] = excel_data.at[row-7, "2021"]

    wb.save('Beneish-M-Score.xlsx')
- On Beforehand, a template is made for calculating the beneish workbook, and the workbook is loaded.
- The process is so easy that all the user has to do is make an entry for a certain company. Using automation, the excel sheet is used to update the data in the appropriate cells.
Streamlit⚡

The fun and exciting portion of Streamlit is now here. Whence did I get that idea?
I purposely put my discussion of Streamlit until last because there is still so much to say about it. You may be wondering, "What is Streamlit?" before we get into the details. So, there you have it.
Streamlit is a Python-based open source application framework. Our data science and machine learning web apps are much faster to develop thanks to it. Scikit-Learn, Keras, PyTorch, SymPy(latex), NumPy, pandas, and Matplotlib are just a few of the popular Python libraries it works with.
It's now up to Streamlit to shape my code with its components into a WEB APP 🕸️.
import streamlit as st
from streamlit_lottie import st_lottie
import hydralit_components as hc

# Streamlit Page Configuration

st.set_page_config(
    page_title="FA",
    page_icon="chart_with_upwards_trend",
    layout="wide",
    initial_sidebar_state="expanded"
)

hide_st_style = """
<style>
#MainMenu {visibility: hidden;}
header{visibility: hidden;}
footer {visibility: hidden;}
</style>

"""
st.markdown(hide_st_style, unsafe_allow_html=True)

# ---Side-Bar----

with st.sidebar:
    st_lottie(lottie_hello, loop=True, key=None, height=320, width=320)
    st.write(''' It's a DEMO!! ''')
With this code, I can set up my web app's basic settings and wireframe.
def load_lottiefile(filepath: str):
    with open(filepath, "r") as f:
        return json.load(f)

lottie_analysis = load_lottiefile("lottiefiles/analysis.json")
lottie_hello = load_lottiefile("lottiefiles/hello.json")
Streamlit's custom component can also load Lottie animations, which can be used to show off some amazing illustrations
# -----Home Page-----

st.title("Analyzing the Quality of Financial Statements using Beneish Model")
with st.container():
    left_col, right_col = st.columns((2, 1))
    with left_col:
        st.dataframe(data)
    with right_col:
        st_lottie(lottie_analysis, height="300",
                  width="500", quality="high", key=None)
# -- Input----

ch = st.number_input('Enter a  number: ')
Inside the st.container() , two separate columns are made One side shows information about the company, while the other shows animations. A user input can also be made with st.number input()
with hc.HyLoader('Now doing loading', hc.Loaders.standard_loaders, index=[3, 0, 5]):
Hydralit components can be used to show loading animations to hide the time it takes to compile the code at run time.
# The Line Chart using Plotly
    fig = px.line(
        temp_ratios,  # Data Frame
        x="Index",  # Columns from the data frame
        y="Ratios",
        title="Financial Ratio Indexes",
    )
    fig.update_traces(line_color="blue")

    with st.container():
        st.plotly_chart(fig)

# Streamlit Buttons
history = cur.fetch_pandas_all()
if st.button("View History"):
        st.snow()
        st.dataframe(history)
As was already said, charts can be made in streamlit, status elements can be made with st.snow() for eye-catching visuals, and buttons can also be made with st.button().
Sigh! 😮💨

What a drag 😦! I thought blogs were supposed to be short! The end of our blog is near, and we'll wrap things up with this post. Thank you for taking the time to read and benefit from my writing. More interesting projects are in the works, and I'll keep you all posted. For now, keep growing 💗 and improving by 1% each day.
Check out the Beneish Pass website.
Source Code
https://github.com/VidhyaVarshanyJS/FAStreamlit
Peace :)🕊️
Follow me for more on:💗 LinkedIn Twitter Github


